Mercer Beacon Networks
Mercer's health consultants did serious analytical work across three separate tools, and switching between them in client meetings was slow and disruptive. This project brought them into one map-focused platform built for real-time client conversations.
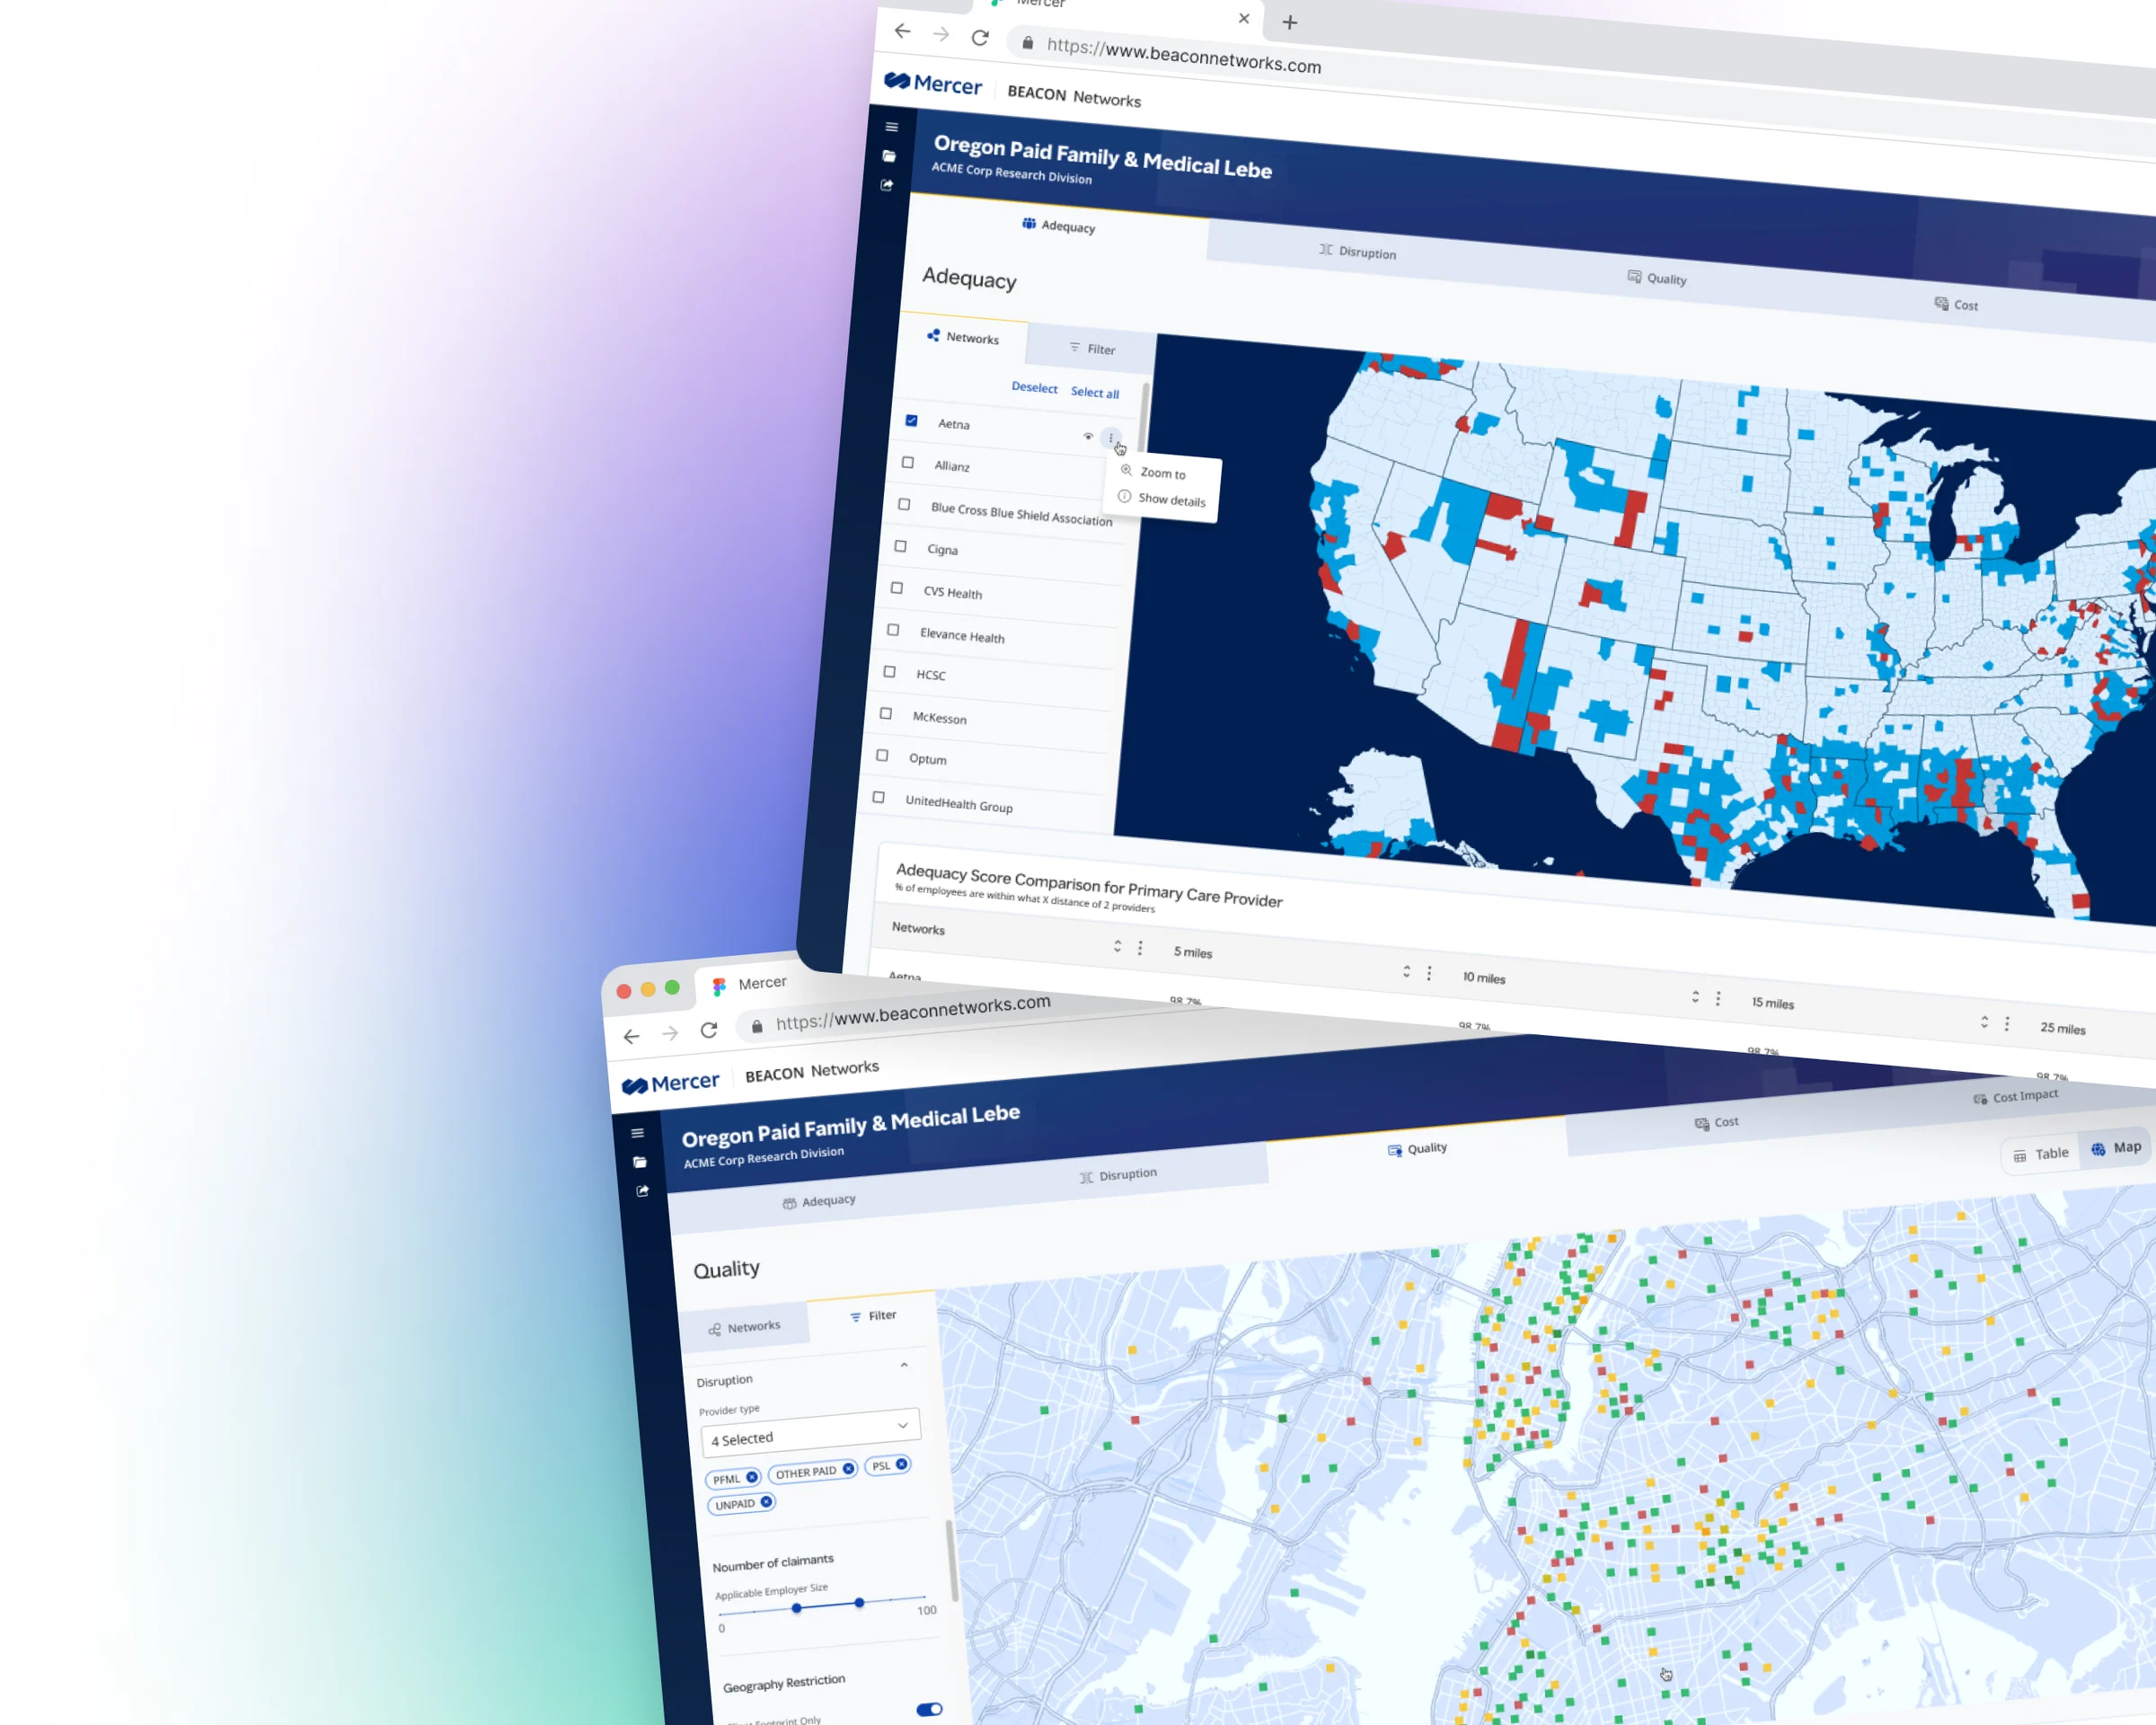
Three tools, one meeting
Mercer consultants were juggling three tools in a single meeting: QualPic for quality, NetPic for discounts, Beacon Value for access and disruption. None of them talked to each other. Insights that should have taken seconds took much longer, and jumping between platforms broke momentum and made a complete picture hard to give on the spot.
One platform, built for the room
Consolidate tools
Merge QualPic, NetPic, and Beacon Value into a single platform so consultants work from one source of truth.
Visualize data
Surface network quality, discounts, and access gaps through map-based views that are easy to read and act on.
Design for live use
An interface that holds up in the room: fast, responsive and clear enough to support real conversations with clients.
Designing for the consultant
Goals
Streamline workflow:
One platform instead of several, to simplify her work and increase efficiency.
Enhance client conversations:
Real-time, data-driven insights during client meetings that deepen engagement and trust.
Holistic network analysis:
Every aspect of the network visualized in one place, for more comprehensive evaluations, better client outcomes and additional revenue for Mercer.
Pain points
Inefficiency in tools:
QualPic, NetPic and Beacon Value each cover part of network quality, access and disruption, making for a fragmented, time-consuming workflow.
Data overload:
Large, complex datasets spread across platforms are overwhelming and delay insights for clients.
Real-time engagement:
Pivoting between tools mid-discussion is slow, limiting how dynamically she can respond and keep clients engaged.
Understand the workflow, then design
We started by interviewing consultants, to understand the workflow before touching any UI, then tested wireframes early and often, watching closely how consultants navigated in client meetings, where the stakes were highest. Every decision came back to one question: does this make the consultant's job easier in the moment that matters most?
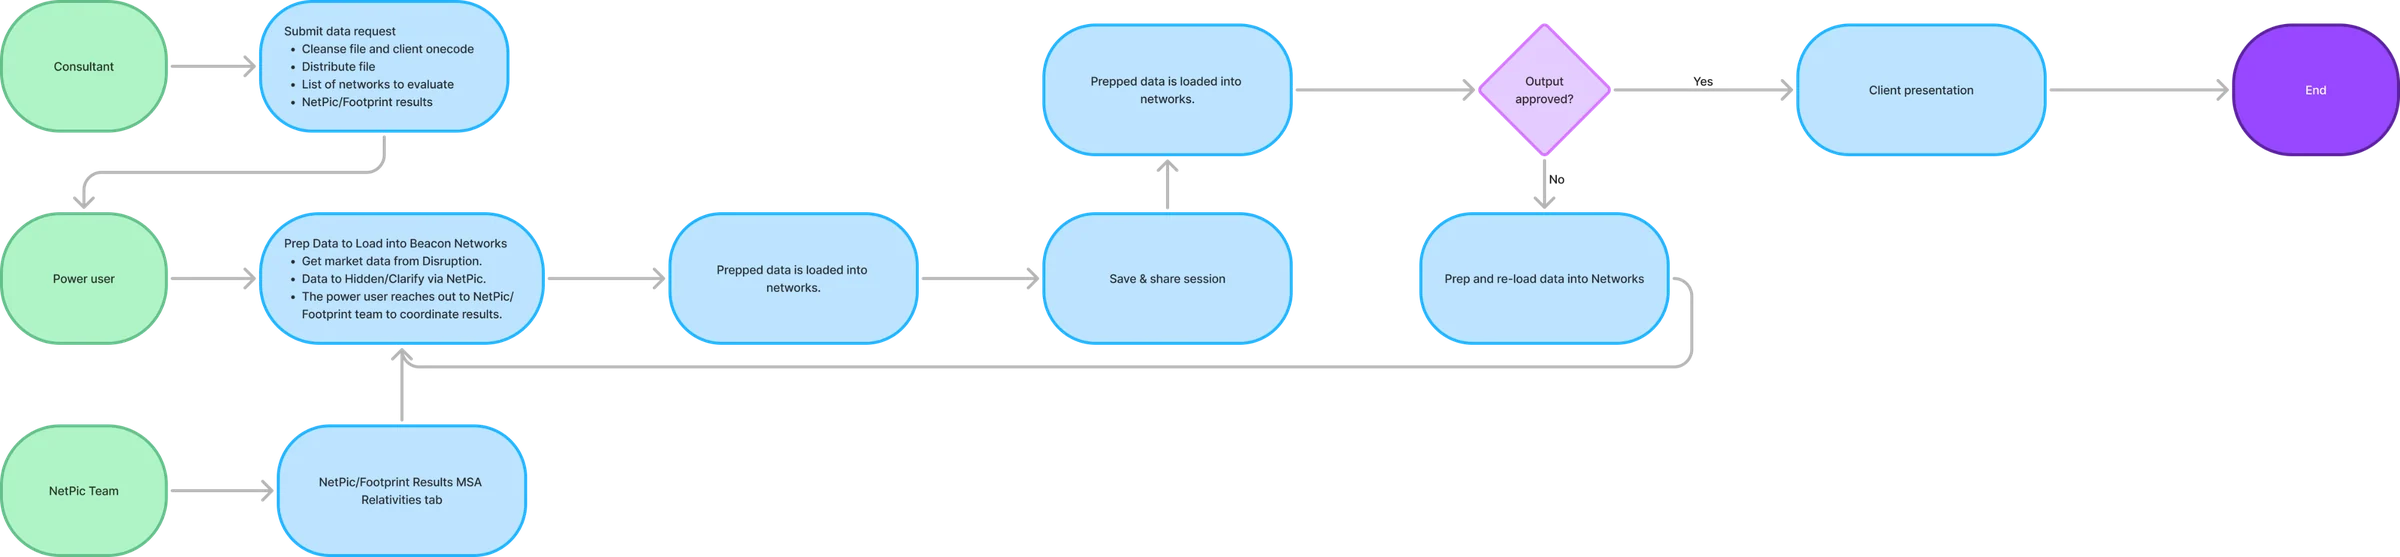
From data request to client presentation
Map-first, focused, not feature-heavy
One map-centered application brings all three data sets together: Clarify quality data layered onto the map, NetPic discount data in a dedicated view, and a claims overlay that surfaces access gaps and high-risk areas at a glance, all filtered by region, specialty or network tier without leaving the screen. Layered controls stay out of the way until you need them.
Role-based permissions keep it clean for each user: consultants configure the data, clients view results without noise, and power users keep the backend accurate through API integrations.
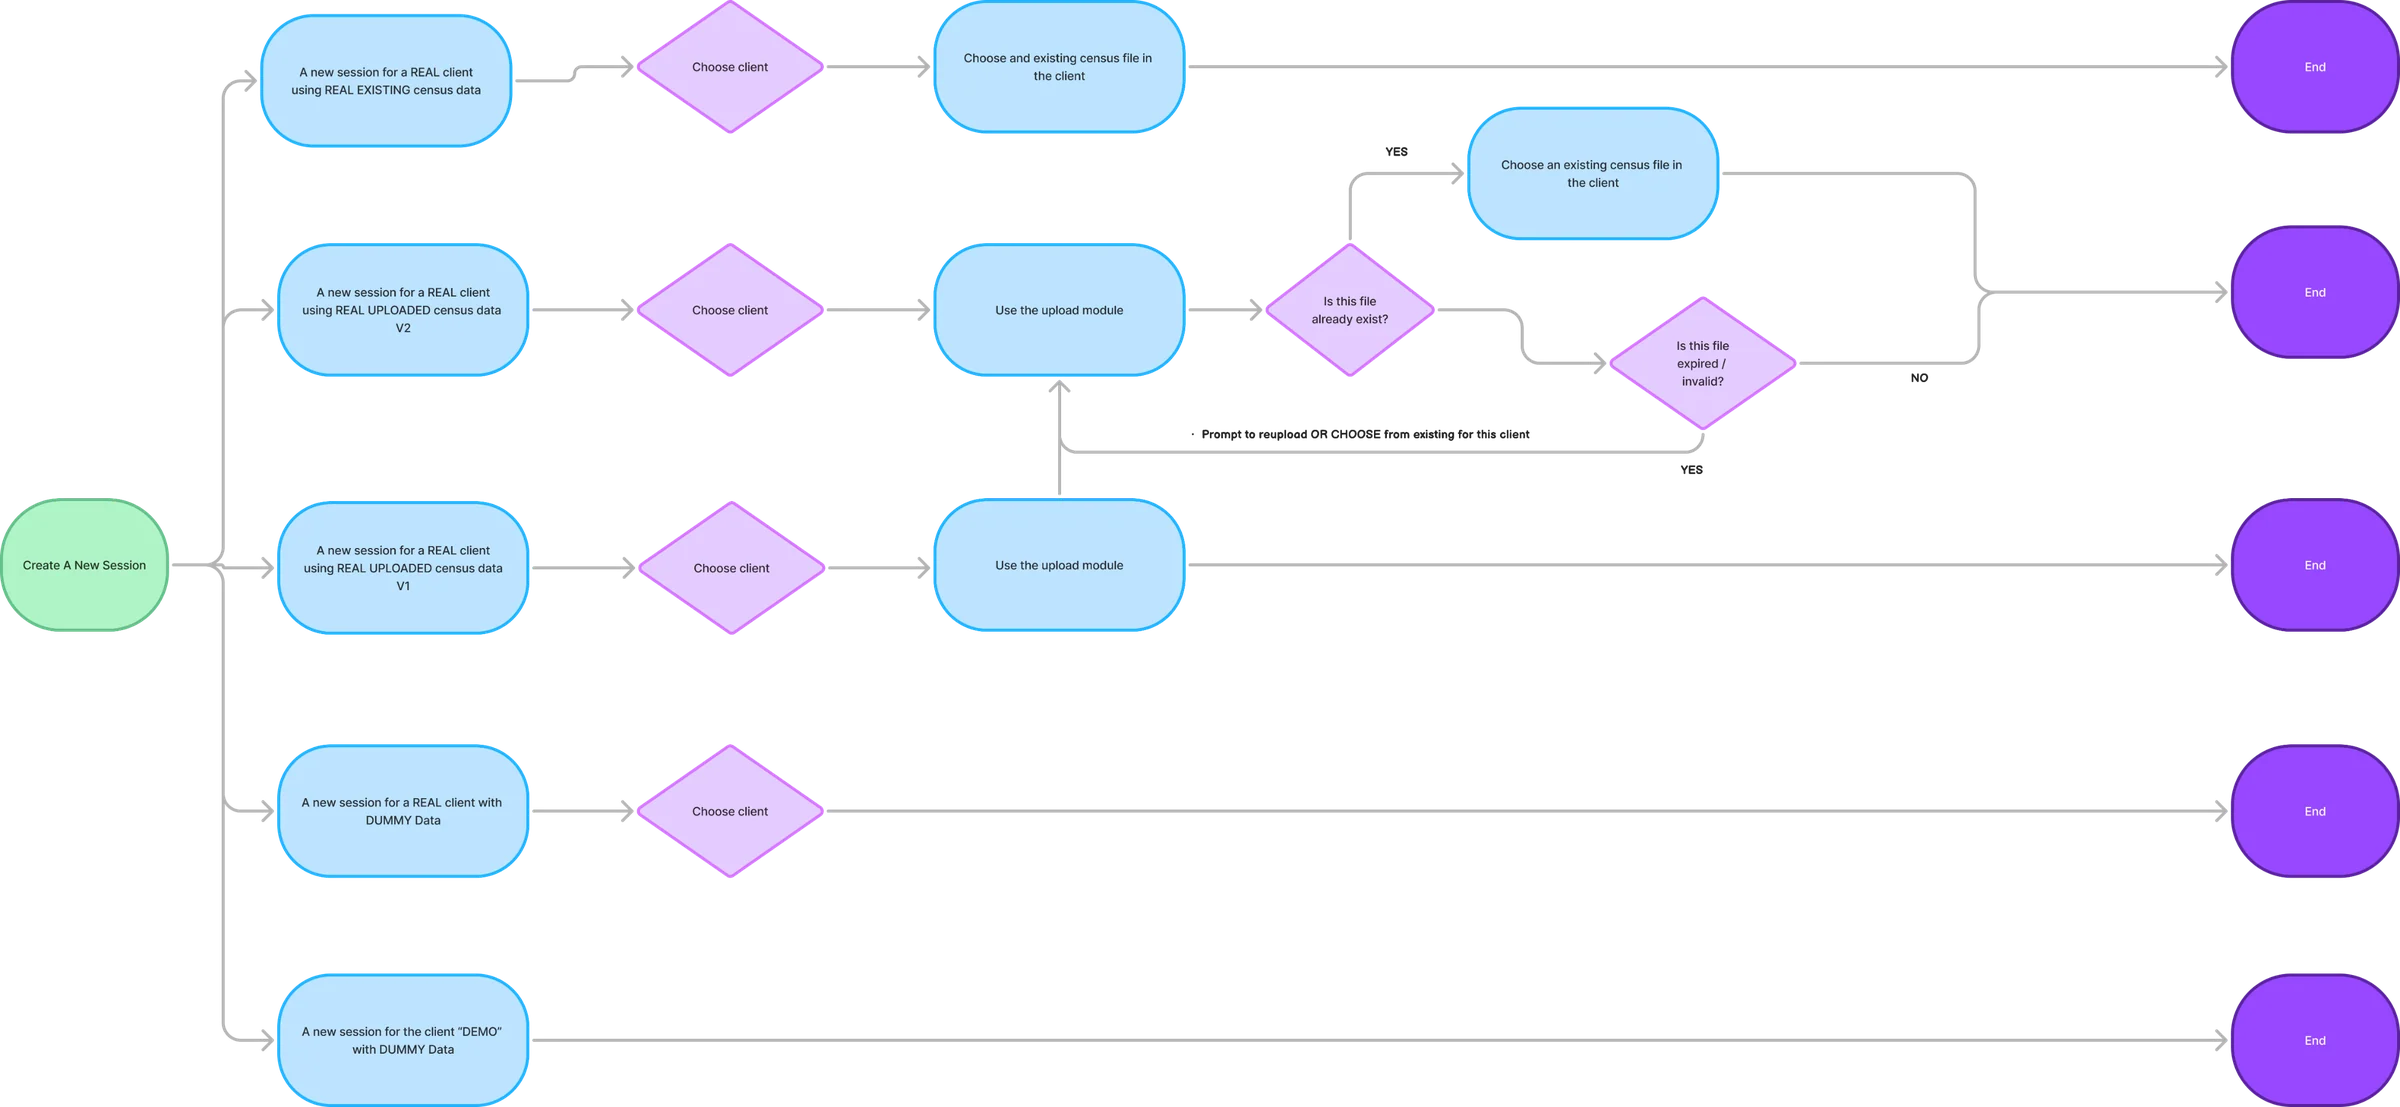
From session setup to quality maps
A workflow fixed, not features added
Beacon Networks gave consultants one place for work that previously took three. Meetings moved faster, consultants answered questions on the spot instead of hunting across platforms, and role-based views cut the noise. For Mercer, that meant stronger client relationships and new revenue opportunities, from fixing a workflow problem, not adding features.